
TikTok Engagement Rate Calculator
Enter a posted video’s views, likes, comments, shares and saves to get its engagement rate by views, plus how many interactions a target rate would need.
Grow your Business & Social Media Marketing
- Branded Link Shortener
- QR Code Generator
- Bio Page Builder
- Tracking & Analytics
- 16+ Integrations
Tools You May Also Need for TikTok Ads
What this calculator measures
This calculator gives you the engagement rate of one TikTok video you’ve already posted, measured against its views. It adds up likes, comments, shares and saves, divides the total by views and shows the result as a percentage. If you add a target rate, it also tells you how many interactions that target would need.
It runs in your browser with the numbers you type. It doesn’t connect to TikTok, so you can use it on your own videos, a client’s or a creator’s figures from a media kit.
The fields and buttons
Two fields are required and four are optional:
- Total Video Views (required)
- Total Likes (required)
- Total Comments
- Total Shares
- Total Saves (Bookmarks)
- Your Target Engagement Rate (%), the rate you’re aiming for, such as 5
Click Calculate Engagement Rate to see the result. Clear empties the form for the next video.
Where to find each number on TikTok
All of these numbers come from the video’s own stats. TikTok’s Creator Academy guide to analytics says the Content tab shows information such as total views, total likes, comments, shares and average watch time, and it doesn’t mention saves. If you can’t find a save count, leave that field empty and note that your rate leaves saves out.
Take every number from the same moment. The counts change as a video keeps getting views, and mixing today’s likes with last week’s views gives a rate that matches neither.
Our test: one video with 18,400 views
We tested the calculator on November 3, 2026, with a fictional outdoor gear brand’s video: 18,400 views, 1,210 likes, 64 comments, 37 shares, 152 saves and a 6% target. The result showed up in about 1.1 seconds, with no request sent to a server.
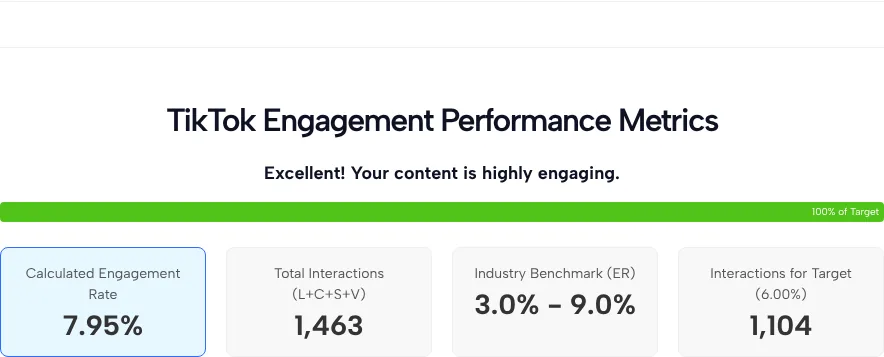
| Result line | Our test |
|---|---|
| Calculated Engagement Rate | 7.95% |
| Total Interactions (L+C+S+V) | 1,463 |
| Interactions for Target (6.00%) | 1,104 |
| Status | Excellent! Your content is highly engaging. |
| Progress bar | 100% of Target |
The formula, checked by hand
Engagement rate here is (likes + comments + shares + saves) / views x 100. In our test, 1,210 likes, 64 comments, 37 shares and 152 saves added up to 1,463 interactions, and 1,463 divided by 18,400 views is 7.95%.
The target line works backward from views. In our test, a 6% rate on 18,400 views needed 1,104 interactions, so the video cleared it by 359.
What you count changes the answer. In our test, likes made up 1,210 of the 1,463 interactions, about 83%. Leave saves out of our test numbers and the same video drops to 7.13%; count only likes and comments in our test and it falls to 6.92%. When you compare rates from different tools or reports, check which interactions each one adds up.
Reading the benchmark range and the progress bar
In our test the Industry Benchmark (ER) line showed 3.0% to 9.0%, which is the calculator’s own range. The page shows no source for it, and it isn’t a figure published by TikTok, so treat it as a rough guide, not a standard your video has to meet.
The progress bar compares your rate with your target, but in our test it stopped at 100%. Our test’s 7.95% against a 6% target is really about 133% of the target, yet the bar read “100% of Target.” If you beat your goal, do that division yourself to see by how much.
The status line, “Excellent!” in our test, is also the tool’s own label.
Views or followers: why other calculators disagree
Some engagement calculators divide interactions by followers instead of views, so the same video can get two very different rates. This one uses views, which ties the rate to the people who actually saw the video.
That choice fits how TikTok works. TikTok’s newsroom post on how For You recommendations work says recommendations take into account interactions such as the videos people like or share and the comments they post, and that follower count isn’t a direct factor. A follower-based rate can make a small account’s well-shared video look far bigger than it is, and make a large account’s video look weaker than it was for the people who saw it.
Measuring a posted video vs predicting a new one
This calculator measures a video that’s already live, using numbers TikTok has counted. The TikTok Engagement Predictor, linked in the tools above, guesses how a video might do before you post it. Use the predictor while you plan and this calculator once the views are in, and you can see how far the guess was off.
Ways to use your engagement rate
One rate on its own says little. It starts to mean something when you compare:
- Your own videos. Run your last 10 posts and look at which hooks, lengths or topics sit at the top. Then test new openings with the TikTok Video Title Generator.
- Creators before a paid deal. Ask for the views, likes, comments, shares and saves on recent posts and run each one. A creator whose rate is steady across posts is easier to plan around than one with a single standout video.
- Before and after a change. Try new captions or tags written with the TikTok hashtag generator on a few posts and compare rates with the posts before.
Limits of the calculator
Keep these in mind before you share a result:
- Only the numbers you type. It doesn’t read TikTok, so a typo or a stale view count changes the answer.
- One video per run. For an account average, run several videos and average them yourself.
- No watch time. How long people watched isn’t part of the formula, so a video people scroll past quickly can still score well on likes.
- Tool’s own benchmark and labels. The benchmark range and the status line have no published source.
- Capped progress bar. Results above your target aren’t shown on the bar.
Engagement Rate Calculator FAQ
How do I work out a TikTok engagement rate by hand?
Add the video’s likes, comments, shares and saves, divide by its views and multiply by 100. In our test, 1,463 interactions on 18,400 views gave 7.95%, the same rate the calculator showed.
Is 3% to 9% TikTok’s official engagement benchmark?
No. That range is built into this calculator, and in our test the page gave no source for it. We didn’t find it on any TikTok page, so compare your rate with your own past videos first.
Why does the bar say 100% when I beat my target?
The progress bar doesn’t go past full. In our test the video reached 7.95% against a 6% target, about 133% of the goal, but the bar still read 100% of Target.
Should I include saves in the calculation?
Include them if you have the number, since they’re one of the four interactions the formula counts. Leaving them out lowers the rate: our test video went from 7.95% to 7.13% without its 152 saves.
Does the calculator connect to my TikTok account?
No. It works only with the numbers you type and calculates in your browser. In our test it sent nothing to a server, so you can use it for any video you have the stats for.
How is this different from the TikTok Engagement Predictor?
The engagement rate calculator measures a video that’s already posted, using its real counts, while the predictor estimates how a video might perform before you post it. They answer different questions.