
TikTok Analytics is the fastest way to stop guessing what works and start making decisions based on what your audience actually does.
Most creators and novice advertisers open it, see a number they do not understand, and close it again.
This guide covers what each metric means, which ones matter most for growth, and how to use the data to make concrete improvements.
In this guide, you will learn:
- How to access TikTok Analytics on mobile and desktop
- Which metrics matter most for organic creators
- Which metrics matter most for brands and paid campaigns
- How to read the retention curve to find where you are losing viewers
- How to use traffic source data to understand where your reach comes from
Get Free TikTok Ad Credit Up to $6000 [Limited Time Offer]

Key Takeaways
- Completion rate and average watch time are the two most valuable metrics for improving organic content performance
- The video retention curve shows you the exact moment viewers drop off, and fixing that moment improves every future video
- Traffic source data tells you whether your reach is coming from FYP, TikTok search, or your follower base
- TikTok Analytics requires a Creator or Business account, and switching is free, instant, and reversible
- According to TikTok’s 2026 Creator Report, creators who actively monitor analytics see 45% faster follower growth
What Is TikTok Analytics?
TikTok Analytics is a built-in dashboard that shows performance data for your account and individual videos. Available on Creator and Business accounts, it tracks metrics including views, completion rate, watch time, engagement rate, traffic source, follower demographics, and audience activity timing. The most important metrics for organic growth are completion rate, re-watch rate, saves, and traffic source distribution.
How to Access TikTok Analytics
TikTok Analytics is available only on Creator and Business accounts. Personal accounts do not have access. Switching is free and reversible. You can switch back to a Personal account at any time with no data loss.
To switch to a Creator account: Go to Settings, Manage Account, then Switch to Creator Account. Follow the prompts and select your content categories.
To access Analytics on mobile: Go to your profile, tap the three horizontal lines (menu), then Creator Tools, and finally Analytics.
To access Analytics on desktop: Log in at business.tiktok.com and navigate to Analytics in the left sidebar. The desktop version shows more data at once and is easier to work with for in-depth analysis.
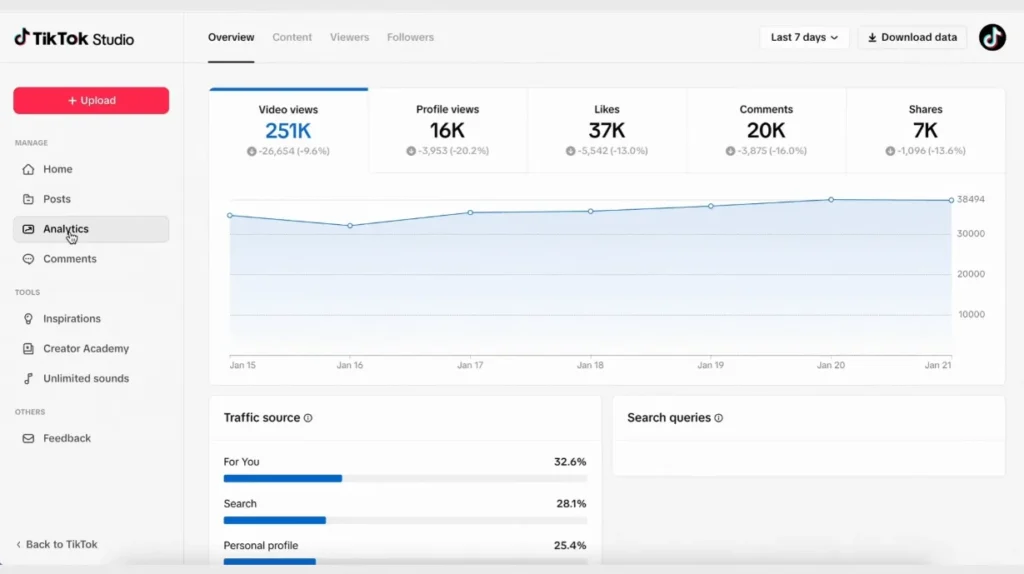
The Analytics dashboard has five main sections: Overview, Content, Followers, LIVE (if you go live), and Shopping (if you use TikTok Shop). Each section surfaces different types of data.
What Does the Overview Tab Show?
The Overview tab is a summary of your account’s performance over a selected time period. You can view data for the last 7, 28, or 60 days, or set a custom date range.
The key metrics in Overview:
Video views: The total number of times your videos were viewed in the selected period. This is a top-line reach metric. A rising view count that is not accompanied by a growing engagement rate or followers suggests you are reaching new audiences but not converting them.
Profile views: How many times someone visited your profile. Spikes in profile views often follow specific videos. Cross-reference these with your top-performing content to see which videos drive the most profile curiosity.
Likes, comments, and shares: Aggregate engagement across all videos. Useful for tracking account-level momentum but less useful than per-video engagement data.
Followers: Net new followers in the selected period. Use this alongside video-level data to identify which content types convert viewers to followers.
Content posted: Number of videos published in the period. Comparing this against your view and engagement metrics helps you understand your per-video efficiency.
What Does the Content Tab Show?
The Content tab is where the most actionable data lives. It shows performance metrics for each individual video you have posted.
Total watch time and average watch time: Total watch time is the sum of all viewing time across every view. Average watch time is total watch time divided by total views. Average watch time tells you how engaged the average viewer was; compare it across videos to identify which formats hold attention longest.
Completion rate: The percentage of viewers who watched your video to the end. This is the most directly actionable metric for algorithmic distribution. Videos with high completion rates get pushed to larger audiences. A completion rate drop on a specific video tells you that format, length, or hook is not working.
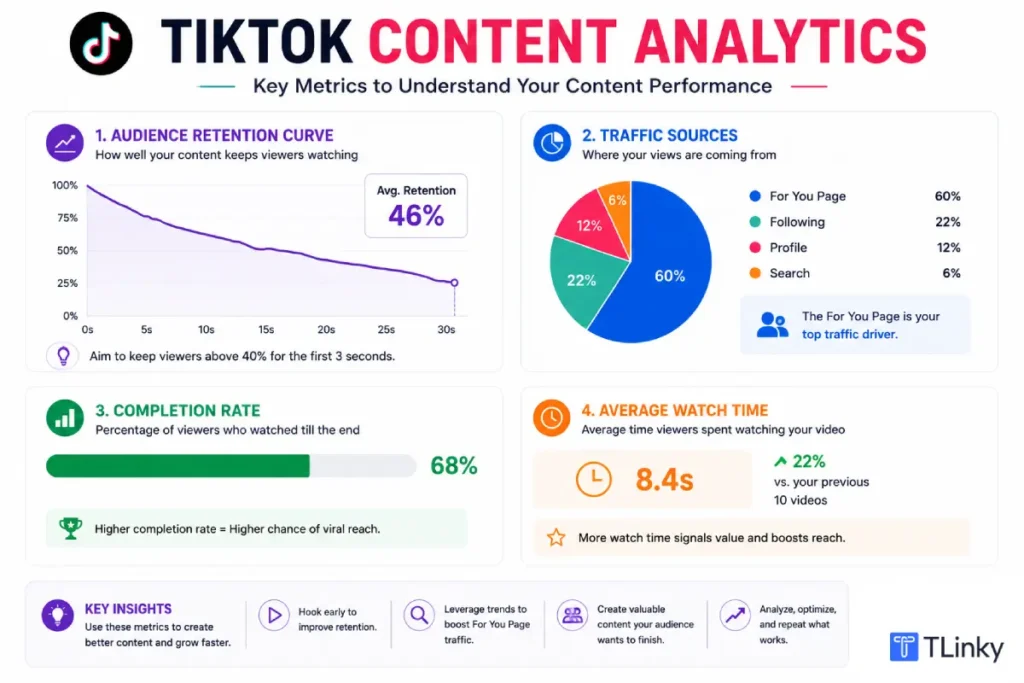
Video retention curve: This is the most underused and most valuable data point in TikTok Analytics. The retention curve shows you exactly what percentage of your initial viewers are still watching at each moment in the video. Where the line drops sharply, you are losing viewers. The specific moment of drop-off tells you where your content loses the thread.
For example: if your retention curve is flat for the first 12 seconds and then drops sharply between 12 and 15 seconds, your hook is working, but your transition into the main content is where viewers leave. That is the section to fix on your next video.
Traffic source: This shows where your views came from: For You page, Following feed, TikTok search, your profile, or other sources. A high FYP percentage means the algorithm is distributing your content organically to non-followers. A high “Following” percentage means reach is concentrated within your existing audience. A growing search percentage means your keyword optimization is working. For organic growth, FYP traffic percentage is the number to watch.
Audience reached: Shows the total number of unique accounts that saw your video. This is different from views, because one account can generate multiple views. Audience reached is a better measure of true reach.
How to Read the Retention Curve
The retention curve is a line graph showing what percentage of your initial viewers are still watching at each second of your video.
A perfect retention curve would be a flat horizontal line at 100%, meaning nobody left. In reality, every video loses viewers throughout, but the shape and speed of the drop matters.
A gradual, slow decline throughout the video means viewers are engaged but naturally dropping off as they finish. This is a healthy retention pattern.
A steep drop in the first two to three seconds means your hook is failing. Viewers are swiping before they commit to watching. Fix the opening.
A sharp drop at a specific point mid-video means something at that moment is causing viewers to leave. Watch your own video at that exact timestamp. It is usually a topic shift that loses the initial promise, a visual drop in quality (bad cut, awkward pause), or information that was not what the viewer expected based on the hook.
A second peak at the end of your video can indicate re-watches. If your view count stays elevated at or near 100% at the end of your video, viewers are looping. That is an excellent re-watch signal for the algorithm.
What Does the Followers Tab Show?
The Followers tab shows demographic data about your audience, including gender distribution, top territories, and activity patterns.
Follower activity timing: This shows when your followers are most active on TikTok, broken down by hour and day. Posting when your followers are active improves your Phase 1 cohort quality, because TikTok’s initial test group includes your followers. The best time to post on TikTok guide uses this principle across different account categories.
Top territories: Shows which countries your followers are concentrated in. If your content is in English but a significant portion of your followers are in non-English-speaking countries, this may affect engagement rates and content expectations. Use this data to tailor captions and audio.
Gender and demographic data: Useful for brand accounts validating that their content is reaching the intended buyer demographic. If you are selling products targeted at women aged 25 to 34 and your follower base skews male and 18 to 24, your content is reaching the wrong audience and needs adjustment.
What Metrics Matter Most for Brands?
Brands using TikTok organically and as a paid channel need to track a different set of metrics depending on their goal.
For organic brand content, the most important metrics are completion rate (content quality signal), saves (intent to return, which suggests content has reference value), shares (particularly DM shares, which carry high algorithmic weight), and traffic source breakdown (to measure how much organic FYP distribution the content earns).
For paid campaigns through TikTok Ads Manager, track: click-through rate (CTR), cost per click (CPC), conversion rate, cost per acquisition (CPA), and return on ad spend (ROAS). These are available in Ads Manager rather than the standard Analytics dashboard.
For TikTok Shop sellers, the Shopping tab in Analytics shows: product clicks from videos, add-to-cart rate, checkout conversion, video-to-click rate (percentage of viewers who clicked a product link), and gross merchandise value (GMV). These metrics sit at the intersection of content performance and sales conversion.
What Is a Good TikTok Completion Rate?
A good completion rate varies by video length. Shorter videos naturally produce higher completion rates because there is less time to lose a viewer.
For videos under 30 seconds, a completion rate above 80% is strong. For videos between 30 and 60 seconds, above 65% is strong. For videos between 60 and 120 seconds, above 50% is strong. For videos over 2 minutes, above 40% is considered a solid performance.
The threshold that matters most for algorithmic distribution is consistently hitting 70%+ for your video category. Videos clearing that threshold across their initial cohort are more likely to receive a wider distribution push.
Compare your completion rate against the length benchmarks above rather than against a universal standard, and use the retention curve to find and fix your specific drop-off points.
How to Use TikTok Analytics to Improve Content
Here is a practical workflow for using analytics to make better content:
Weekly review: Once per week, open the Content tab and sort your last seven videos by completion rate. Note which three performed best and which two performed worst. Look for a pattern in format, topic, video length, or hook type.
Retention curve audit: For your lowest completion-rate video of the week, watch the retention curve and identify the drop-off point. Watch your own video at that timestamp. Identify what changed at that moment — topic, visual energy, pacing. Apply that fix to your next video.
Traffic source check: Once per month, look at your traffic source breakdown across all videos. Is FYP traffic growing, flat, or declining? If declining, your content is not clearing the algorithmic distribution threshold consistently. Return to completion rate improvements and hook quality.
Follower activity calibration: Check the Followers tab monthly and adjust your posting times if your audience activity window has shifted. Posting at the wrong time reduces Phase 1 cohort quality, which affects every video’s chance of wider distribution.
The TikTok Engagement Predictor can estimate how new content is likely to perform before you post, using your historical analytics data as the baseline.
FAQs
Do I lose anything by switching from a Personal to a Creator account?
You lose access to some commercial sounds, which are a subset of licensed tracks available only to personal accounts. You gain TikTok Analytics, Creator tools, and the ability to run ads. For most creators and all brand accounts, the trade-off is heavily in favor of switching.
How far back does TikTok Analytics go?
The native TikTok Analytics dashboard retains up to 60 days of data on mobile and a longer range on desktop. For historical data beyond that, you need to export regularly or use a third-party analytics tool like Metricool or Sprout Social that archives your data continuously.
Why do my analytics show a different view count than what appears on my videos?
Views on the video itself count differently than analytics views in some cases — video views in analytics can take time to update and may exclude certain traffic sources depending on your account type. Small discrepancies are normal. Large discrepancies may indicate a data sync delay; refresh after a few hours.
Can I see analytics for a video before it gains traction?
Yes. Analytics data starts populating within a few hours of posting, even for videos with very few views. Early retention curve data, even from a small initial audience, can tell you whether your hook is working before the video reaches a wider audience.
Is there a free third-party TikTok analytics tool?
Metricool offers a free tier that covers basic TikTok analytics and allows some historical data retention beyond TikTok’s native 60-day limit. Sprout Social and Hootsuite offer TikTok analytics as part of paid social media management packages. For most independent creators, TikTok’s native analytics is sufficient.
Wrapping Up
TikTok Analytics is only useful if you look at it regularly and act on what it shows you. The two most actionable data points, completion rate and the retention curve, tell you directly which videos held attention and exactly where the ones that did not lost it.
Start with a weekly review of completion rates across your last seven videos, a monthly review of traffic source trends, and a retention curve audit for your lowest-performing video each week. That three-point routine, repeated consistently, produces faster improvement than any other optimization tactic.
For the algorithm context behind why these metrics matter, the TikTok algorithm guide explains how completion rate and traffic source signals translate to distribution decisions. The organic TikTok strategy guide shows how to connect analytics insights to a consistent posting system.
Sources
- TikTok Analytics Dashboard Guide 2026: Metricool
- TikTok Creator Metrics Guide 2026: InfluenceFlow
- TikTok Metrics: What to Track and Why in 2026: Printify
- What TikTok Metrics to Track for TikTok Marketing: Sprout Social
- TikTok Business Analytics: Complete Guide: Improvado