
TikTok Ad Frequency Calculator
The TikTok Ad Frequency Calculator divides your impressions by your reach to show how many times the average person saw your ad, or forecasts it from a budget, a target CPM and an audience size before you launch.
Grow your Business & Social Media Marketing
- Branded Link Shortener
- QR Code Generator
- Bio Page Builder
- Tracking & Analytics
- 16+ Integrations
Tools You May Also Need for TikTok Ads
What ad frequency tells you on TikTok
Ad frequency is the average number of times each person saw your ad. TikTok’s basic metrics page defines Frequency as the average number of times each user saw an ad over a given time period, and Reach as the number of unique users who saw ads at least once.
So frequency is simply impressions divided by reach. A frequency close to 1 means most people saw the ad once. A frequency of 6 means the average person has seen it six times, so your budget keeps landing on the same group of people.
Frequency is one of several TikTok ads metrics worth reading together. On its own it can’t tell you if an ad works, but it does tell you how hard you’re leaning on one audience.
Which tab to open first
Open Calculate Actual Frequency when an ad is already running, and Forecast Ad Fatigue when you’re still planning one. Both tabs ask for an Industry / Niche and both have a Clear button.
Calculate Actual Frequency (the default tab) takes three required fields:
- Total Impressions, from your campaign or ad group report.
- Total Reach (Unique Users), from the same report and the same date range.
- Industry / Niche, such as outdoor gear or skincare.
Click Analyze Ad Frequency. You get the Calculated Frequency, a Fatigue Risk label, your Unique Reach, an Expert Analysis Summary and three Actionable Recommendations under Creative Refresh, Audience and Budget / Bidding.
Forecast Ad Fatigue takes four required fields:
- Ad Budget ($), what you plan to spend.
- Target CPM ($), what you expect to pay per 1,000 impressions.
- Estimated Audience Size, how many people your targeting covers.
- Industry / Niche.
Click Forecast Ad Fatigue. You get a Forecasted Frequency, Est. Impressions, a Fatigue Risk label, a summary and three recommendations under Budget Sizing, Creative Volume and Targeting.
The tent brand test
We ran both tabs on November 3, 2026, for a fictional Colorado outdoor gear brand selling a $189 ultralight tent. On the actual frequency tab we entered 150,000 impressions and 52,000 reached people, and the report came back in about 3.9 seconds.
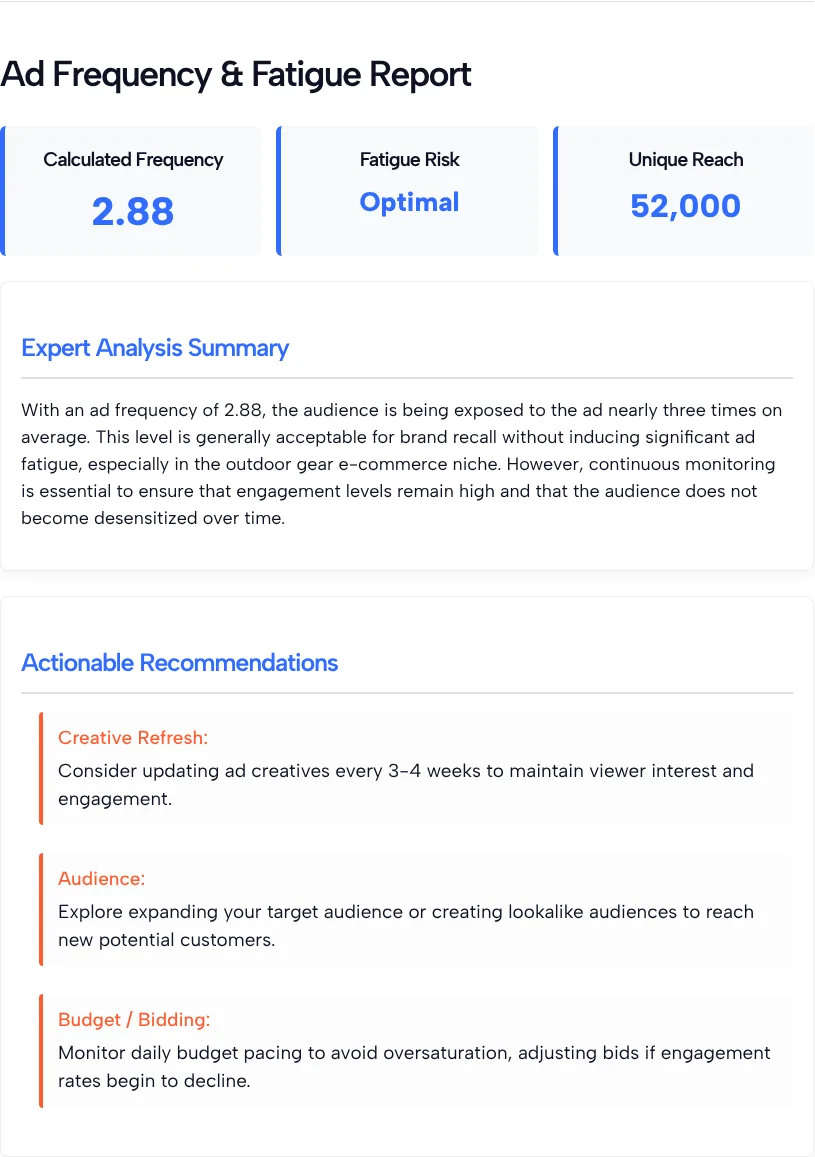
It returned a frequency of 2.88 and a Fatigue Risk of Optimal. The recommendations suggested refreshing creatives every 3 to 4 weeks, testing lookalike audiences and watching daily budget pacing. That refresh timing is the AI’s suggestion, not a TikTok rule.
In our test of the forecast tab, we entered a $3,000 budget, a $9.50 target CPM and an audience of 400,000 people. In about 3.8 seconds it returned:
| Forecast line | Our test |
|---|---|
| Est. Impressions | 315,789 |
| Forecasted Frequency | 0.79 |
| Fatigue Risk | Optimal Pacing |
How the calculator gets its numbers
The math is plain division, and we checked each step of our test by hand:
- Frequency: impressions divided by reach. In our test, 150,000 divided by 52,000 is 2.8846, which the tool rounds to 2.88.
- Impressions: budget divided by CPM, times 1,000. In our test, $3,000 at a $9.50 CPM buys 315,789 impressions.
- Forecasted frequency: those impressions divided by the audience size. In our test, 315,789 divided by 400,000 is 0.79.
That last figure needs care. A real frequency can’t drop below 1, because anyone counted in reach saw the ad at least once. The forecast tab assumes every person in your audience gets reached, so 0.79 is really impressions per person in the audience.
Your campaign won’t reach everyone in the audience, so your real frequency will land higher. If the same 315,789 impressions reached only half of those 400,000 people, frequency would be 1.58. Run the forecast with a smaller audience number to see a more cautious version.
Reading the Fatigue Risk label
Treat the Fatigue Risk label as the tool’s own opinion. The page doesn’t show what thresholds sit behind Optimal or Optimal Pacing, and the analysis and recommendations are written by an AI model.
To actually limit exposure, TikTok’s frequency control features page describes a frequency cap, which sets the most times a user is shown your ad in a set period, and target frequency, which sets how many times you want each person in your audience to see your ads on a weekly basis.
The calculator can’t set either one for you. It helps you decide whether you need them.
Ways to put the number to work
The actual frequency tab is most useful a week or two into a campaign. If frequency keeps climbing while reach stays flat, you’re paying to show the same video to the same people. That’s a cue to plan new creatives, and the TikTok Ad Testing Tool can sketch a few variants to try.
Run it per ad group, too. Two ad groups with the same spend can sit at very different frequencies when one targets a much smaller audience.
The forecast tab helps before launch. Plug in your budget and audience and see whether the plan spreads impressions thin or piles them onto a small group. For the audience number, use the audience size estimate in TikTok Ads Manager, or get a rough AI range from the TikTok Ad Audience Size Estimator if you don’t have an ad account yet. For CPM, your own past campaigns beat any average, and our guide to what TikTok advertising costs covers how pricing works.
What the calculator can’t see
The calculator only knows the numbers you type in:
- No account connection. It never reads your TikTok data, so copy impressions and reach from the same report and date range.
- One result per run. To compare ad groups, run each one separately and note the results.
- A best-case forecast. The forecast tab assumes your whole audience is reached, so expect real frequency to be higher.
- AI labels and tips. Industry / Niche shapes the written analysis. The frequency math uses only your numbers.
TikTok Ad Frequency Calculator FAQ
How do I calculate TikTok ad frequency by hand?
Divide total impressions by total reach for the same date range. In our test, 150,000 impressions over 52,000 people gave 2.88, the same figure the calculator returned.
Why is my forecasted frequency below 1?
The forecast tab divides estimated impressions by your whole audience size, as if every person in it gets reached. Real campaigns reach only part of an audience, so treat a result like 0.79 as impressions per person in the audience. Your real frequency will be higher.
What frequency is too high for a TikTok ad?
There’s no single number that fits every ad. Watch what happens to your click-through rate and cost per result as frequency climbs. When results get worse while frequency rises, the audience has likely seen the ad enough.
Can I limit how often people see my ad on TikTok?
Yes, for Reach, Reach & Frequency, TikTok Pulse Suite and some Video views ad groups. TikTok’s frequency cap help article says you set the cap in the ad group under Bidding and optimization, as a number of impressions over a period of days.
Does the calculator connect to my TikTok Ads Manager account?
No. It works only with the numbers you type. Copy impressions and reach from your own report before you start.
Does the Industry / Niche field change the result?
Only the written part. The analysis and tips mention your niche, while the frequency and impression numbers come only from the figures you enter.