
TikTok Ad Spend Tracker
The TikTok Ad Spend Tracker takes four totals from one campaign (ad spend, revenue, conversions and link clicks) and shows revenue minus ad spend, ROAS, cost per conversion and cost per click, worked out in your browser.
Grow your Business & Social Media Marketing
- Branded Link Shortener
- QR Code Generator
- Bio Page Builder
- Tracking & Analytics
- 16+ Integrations
Tools You May Also Need for TikTok Ads
A one-off campaign check, not a running log
The TikTok Ad Spend Tracker is a one-off calculator: you type four totals, click once, and it shows where that campaign stands. The math runs in your browser and nothing is saved, so reloading the page or clicking Clear wipes the result.
It doesn’t connect to TikTok Ads Manager or your store either. If you want a history of your spend, run the check once per period (a week or a month works well) and copy the results into your own sheet.
Filling in the four fields
Every field is required, and most of them map to columns you can export from Ads Manager. TikTok’s basic metrics page defines Cost as total ad spend, counts a conversion each time an ad resulted in the optimization event you selected, and separates Clicks (destination), the clicks that lead to your chosen destination, from Clicks (all), which also include social interactions.
- Total Ad Spend ($): the Cost column for the campaign and dates you’re checking.
- Total Revenue Generated ($): the sales you can tie to that campaign over the same dates, from your store or your conversion value reporting.
- Total Conversions (Sales/Leads): your purchases or leads. If the campaign optimizes for something else, such as add to cart, take the purchase count from your store so the CPA means cost per sale.
- Total Link Clicks: Clicks (destination). Entering Clicks (all) instead would make your CPC look cheaper than it really is.
Click Analyze Performance. The result appears under the form right away. A negative number in any field gets a warning instead of a result.
What came back for a $1,200 tent campaign
We tested the tracker on November 3, 2026, with numbers for a fictional Colorado outdoor gear brand, Ridgeline Trail Co.: $1,200 in ad spend, $3,900 in revenue, 78 conversions and 2,600 link clicks. The result showed up in about 0.1 seconds.
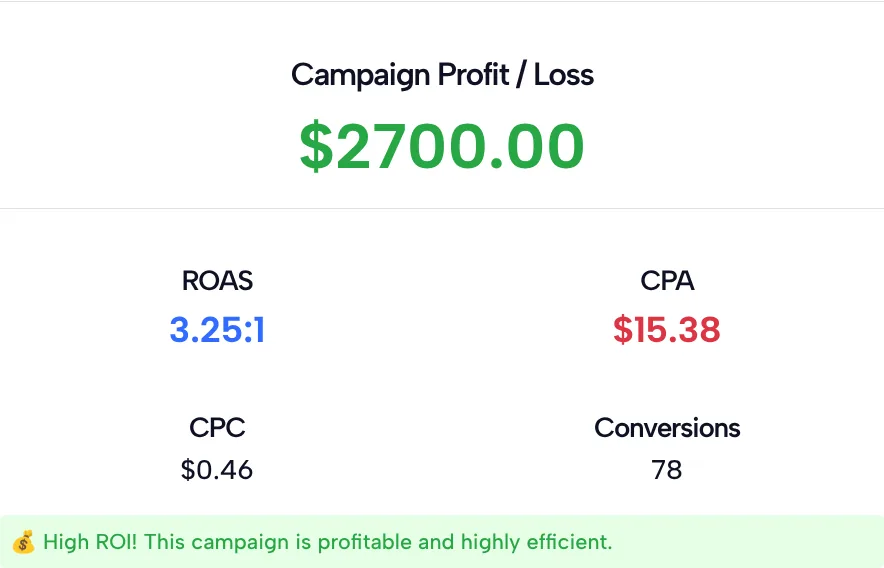
All four figures in our test check out by hand. $3,900 minus $1,200 is $2,700. $3,900 divided by $1,200 is 3.25. $1,200 split across 78 conversions is $15.38 each, and across 2,600 clicks it’s about $0.46 each.
The five result cards, and what each one leaves out
Each card is one simple formula on the numbers you entered. Here’s what it measures and what it doesn’t.
| Card | How it’s worked out | What it ignores |
|---|---|---|
| Campaign Profit / Loss | Revenue minus ad spend | Product cost, shipping, payment fees, returns |
| ROAS | Revenue divided by ad spend, shown as 3.25:1 | Your margins |
| CPA | Ad spend divided by conversions | What each conversion was worth |
| CPC | Ad spend divided by link clicks | Whether those clicks bought anything |
| Conversions | The number you typed, shown back | Nothing is calculated |
The big green or red number at the top is the one to read carefully. It’s revenue left after ad spend, not net profit. If your products, shipping and fees cost 60% of revenue, the $3,900 in our test leaves $1,560 before ads and $360 after the $1,200 in spend, while the card still shows $2,700.
To see the profit after product costs, run the same numbers through the TikTok Ads ROI Calculator, which has a field for product costs. You’ll find it in the “Tools You May Also Need for TikTok Ads” row near the top of this page.
The colors are the tool’s own scale, not a TikTok rating. ROAS turns green at 4:1 and up, blue from 2:1 to just under 4:1, and red below 2:1. CPA is shown in red whenever it has a value, so red there doesn’t mean your cost is too high.
How the verdict line is chosen
The one-line verdict comes from two checks the tool runs on your numbers, and both thresholds are its own:
- Revenue above ad spend and ROAS of 2:1 or more: “High ROI! This campaign is profitable and highly efficient.”
- Revenue above ad spend but ROAS under 2:1: “Profitable Campaign. Positive profit, but aim for a higher ROAS.”
- Revenue equal to or below ad spend: “Negative Profit. The campaign is losing money. Immediate optimization or pause is required.”
So a campaign that exactly breaks even gets the “Negative Profit” message. And “High ROI” only means revenue covered ad spend at least twice over. If your margins are thin, a campaign can earn that label and still lose money. If your costs are the same 60%, a 2:1 ROAS turns every $100 in ad spend into $200 in revenue, $80 left after costs and a $20 loss.
Turning one-off checks into a spend log
The tracker forgets everything, so the log has to live with you. A simple routine works:
- Pick a fixed window. Check the same campaign every Monday for the past seven days, or on the first of the month for the month before. Spend and revenue must cover the same dates.
- Write down all five numbers and the dates. A spreadsheet with one row per check lets you see CPA and CPC drift over time, which one result never shows.
- Look upstream when CPC rises. A falling click-through rate is a common reason, and the TikTok CTR Calculator shows it from your impressions and clicks.
- Compare costs with a rough range. The TikTok Ad Cost Estimator by Country gives AI-estimated CPM and CPC ranges for a country and niche, a rough yardstick to hold your own costs against.
- Keep other traffic separate. If you also share the same product page in your bio or through a creator, give each one its own short trackable link so those sales don’t get counted as ad revenue.
For what each of these metrics means inside Ads Manager, and which ones to add to your sheet next, see our guide to TikTok ads metrics.
TikTok Ad Spend Tracker FAQ
Does the tracker save my campaigns between visits?
No. It works out the numbers in your browser and keeps nothing. Reloading the page or clicking Clear removes the result, so copy the five figures into your own spreadsheet if you want a record.
Is Campaign Profit / Loss the same as my net profit?
No. It’s revenue minus ad spend and nothing else. In our test, $3,900 in revenue and $1,200 in ad spend showed $2,700.00, with no deduction for products, shipping, fees or returns.
Why does CPA say N/A (No Conversions)?
You entered 0 conversions with some ad spend, and a cost per conversion can’t be divided by zero. CPC does the same with 0 link clicks and shows N/A (No Clicks).
Why does a campaign that broke even say Negative Profit?
The tool only shows a profitable message when revenue is above ad spend. If the two are equal, Profit / Loss shows $0.00, but the verdict falls through to the Negative Profit line.
Can I enter totals from several campaigns at once?
Yes. Add up spend, revenue, conversions and link clicks across the campaigns and enter the sums. The result is a blended average, though, so a weak campaign can hide behind a strong one. Check them one by one before you move budget.
Which clicks should I enter if my ad sends people to TikTok Shop or a lead form?
Use the clicks that reached the place where people buy or sign up. The CPC card then shows what each visit to that page cost you.