
QR codes stopped being a pandemic workaround around 2023. By 2026, they are embedded in how people pay for coffee, check restaurant menus, confirm event tickets, read product labels, and share contact information.
The scanning behavior that felt experimental in 2020 now happens more than 2 billion times per day globally.
The problem with most QR code statistics articles is that they hand you a list of numbers without telling you what to do with them.
Knowing that 102.6 million Americans will scan a QR code in 2026, according to eMarketer, is useful context.
Knowing which industries lead on adoption, what makes consumers hesitate, and where the technology is heading next is what actually changes how you use QR codes in your work.
One major shift in 2026 that most statistics articles have not covered: GS1, the global supply chain standards body, is on track to bring 2D QR codes to point-of-sale scanning alongside traditional UPC barcodes across global retail by the end of 2027.
That transition is already being tested across 48 countries representing 88% of world GDP, according to GS1. This is not a trend to monitor. It is a scheduled infrastructure change.
In this article, you will find:
- Verified global and US QR code usage numbers with named primary sources
- Industry adoption rates across hospitality, retail, CPG, and finance
- Consumer behavior data on when, where, and why people scan
- QR code payment market size and growth projections
- Trust and security statistics, including phishing trends
- What the GS1 Sunrise 2027 transition means for retail and packaging
- A decision guide matching different business types to the stats most relevant to them
Key Takeaways
- 102.6 million Americans are projected to scan a QR code in 2026, roughly one in three, according to eMarketer
- The global QR code market is valued at $15.23 billion in 2026 and projected to reach $33.14 billion by 2031, growing at a 16.82% CAGR, according to Mordor Intelligence
- 44% of consumers scan weekly or daily, and only 8% have never scanned a QR code, according to Uniqode’s State of QR Codes 2026 report
- Dynamic QR codes account for 65% of global QR code revenue share and continue to widen their lead over static formats, according to Mordor Intelligence
- GS1 is on track to make QR codes scannable alongside UPC barcodes at checkout across 48 countries by the end of 2027, a supply chain shift that affects every brand selling physical products
Quick Answer
In 2026, QR codes are a mainstream consumer behavior with over 102 million US users expected to scan monthly. The global market is valued at $15.23 billion and growing at nearly 17% annually. Industry adoption is highest in hospitality, retail, and consumer packaged goods. The biggest shifts to watch are the GS1 retail transition, rising payment volumes, and a trust gap that brands can close with better QR code placement.
QR Code Market Size and Growth
The QR code industry crossed $13 billion in 2025 and has grown into a permanent piece of how businesses connect physical touchpoints to digital experiences.
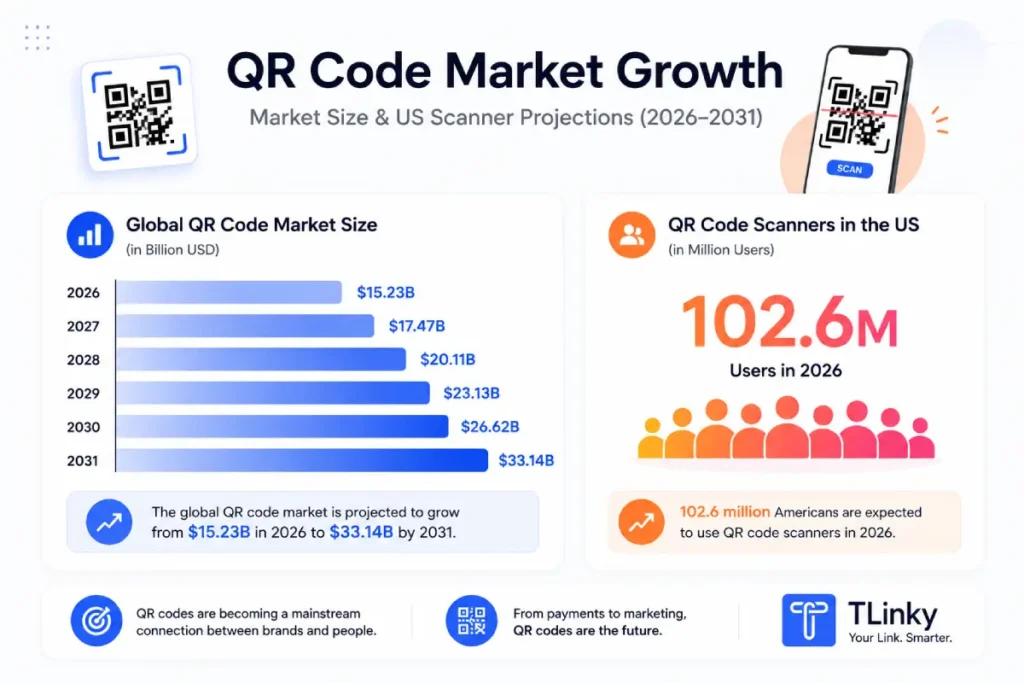
The global QR code market is valued at $15.23 billion in 2026 and is projected to reach $33.14 billion by 2031, registering a compound annual growth rate (CAGR) of 16.82%, according to Mordor Intelligence.
Asia-Pacific accounts for 37.59% of 2025 QR code market revenue and is forecast to remain the largest regional contributor through 2031, driven by mobile payment adoption in China, India, and Southeast Asia.
The marketing and advertising segment is the fastest-growing QR code application category, expanding at a projected CAGR of 18.16% through 2031, according to Mordor Intelligence.
QR Code Payment Market
QR code payments represent a significant portion of total market growth, particularly in Asia and Latin America.
QR Code payment market size is expected to grow to $74.30 billion by 2034, according to Polaris Market Research.
Unlock the Power of QR Codes! with 14+ different types of QR codes!
Elevate your marketing game with TLinky’s QR Code Generator. Create dynamic, eye-catching QR codes in seconds.
Restaurant QR code payments led the payment market in 2024 with a 28.3% global revenue share, according to Grand View Research. Restaurants increasingly use QR code ordering and payments to streamline ordering, reduce waiting times, and improve operational efficiency, although reported improvements in table turnover vary by implementation, and no universally accepted global benchmark exists.
How Many People Scan QR Codes in 2026?
The short answer: a lot more than most marketers realize. Scanning is no longer the behavior of early adopters.
In the US alone, 102.6 million smartphone users are projected to scan QR codes in 2026, representing roughly one in three Americans, according to eMarketer. Globally, QR code scanning is estimated at over 2 billion scans per day.
Over 50% of global internet users scan at least one QR code every month, according to We Are Social’s Digital Statshot Report. Among consumers surveyed by Uniqode, 70% reported scanning at least once a month, and 44% scan weekly or daily.
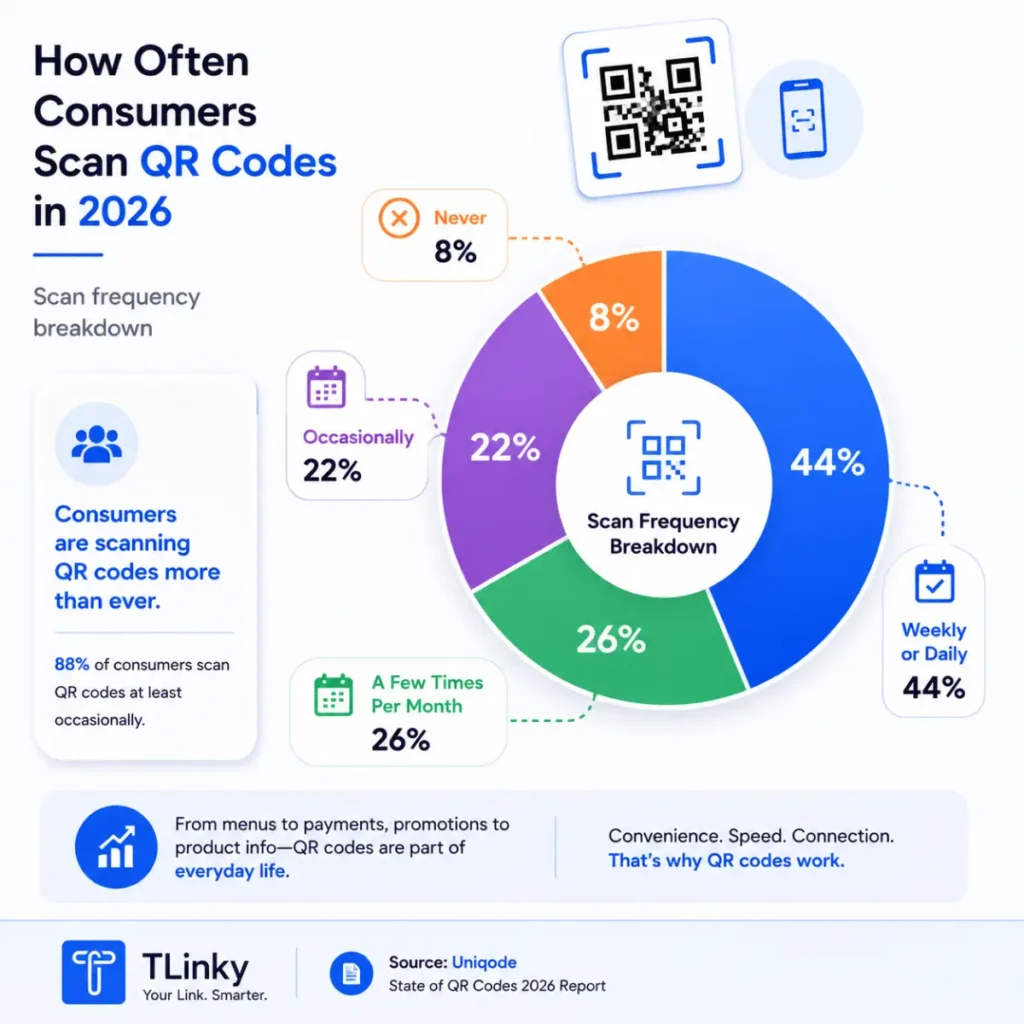
Only 8% of consumers have never scanned a QR code, down from significantly higher figures in pre-pandemic surveys, according to the State of QR Codes 2026 by Uniqode.
Consumer Scanning Behavior: When, Where, and Why
Understanding where and when people actually scan a QR code is more useful than knowing how many people scan in aggregate.
Where People Scan QR Codes
According to Uniqode’s analysis of 188 million real scans processed in 2025, the top three places consumers scan are restaurants (58%), websites (42%), and product packaging (40%).
These results also highlight why where you place a QR code matters. Different surfaces and printed materials perform differently depending on the audience, visibility, and scanning context. Learn more in our guide to using QR codes on different materials.
These are high-intent moments. Someone scanning a product package is actively considering a purchase. Someone scanning a restaurant QR code is at the table and ready to order. The context of the scan determines what the landing page needs to deliver.
Scan timing follows predictable daily patterns. The peak scan window globally is 4 PM to 9 PM UTC, which aligns with evening dining, in-store shopping, and end-of-day mobile activity.
Peak month in 2025 was December, with 17 million total scans and an average of 70 scans per code, according to Uniqode.
Why People Scan QR Codes
People scan for information, not novelty. According to TEAM LEWIS research, the most common reasons are to access restaurant menus (48%), download mobile apps (47%), view product information (43%), connect to Wi-Fi networks (32%), and retrieve event tickets (31%).
This access-to-information pattern means that landing page quality directly determines whether a scan converts or bounces. A QR code on product packaging that resolves to a generic homepage wastes the scan intent.
Who Scans Most
Scanning is concentrated in younger demographics but is no longer limited to them. Half of Gen Z (49%) and Millennials (51%) scan QR codes at least once a week, according to TEAM LEWIS. Older age groups show lower frequency but are no longer rare scanners.
Industry Adoption Statistics
QR code adoption is not evenly distributed. Some industries have built QR codes into their core operations. Others are still using them as optional add-ons.
Hospitality and Restaurants
Over 80% of full-service restaurants globally now use digital menu QR codes, according to industry estimates.
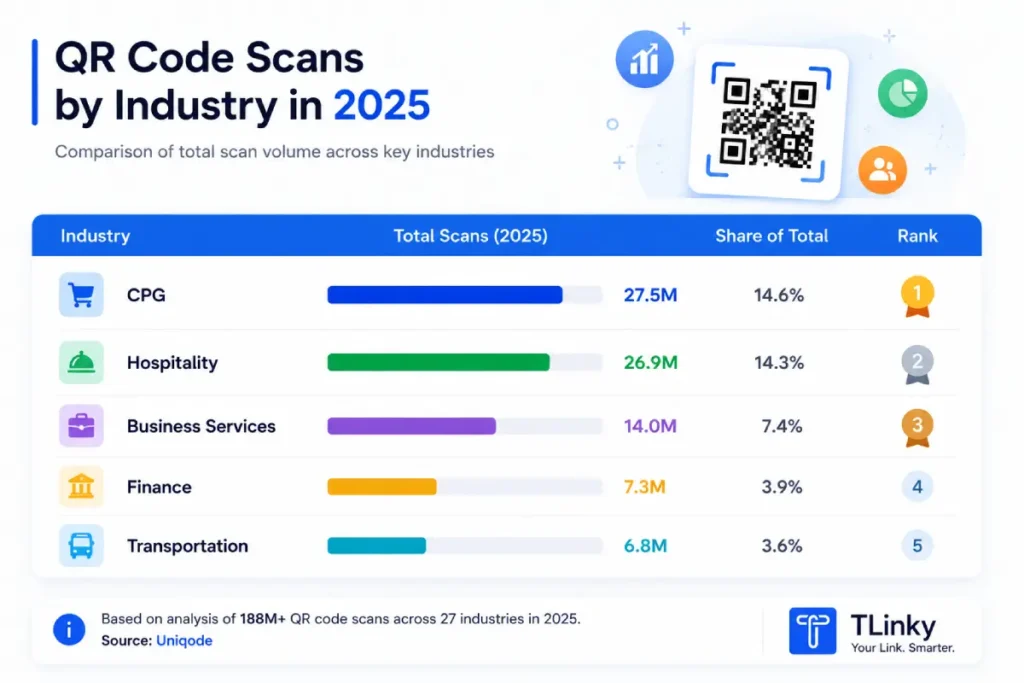
The hospitality sector generated 26.9 million total scans in 2025 on the Uniqode platform, second only to consumer packaged goods, with an average of 328 scans per QR code.
Georgia leads US hospitality scanning volume with 4.7 million scans. Peak scan time for hospitality is 5 PM to 8 PM UTC, with a secondary spike from 10 PM to 1 AM.
For restaurant operators, QR codes for restaurants now cover menus, payment, loyalty program sign-ups, and review requests. The QR code is not just a menu replacement. It is the beginning of a customer data relationship.
Consumer Packaged Goods
Consumer packaged goods (CPG) led all industries by total scan volume in 2025, with 27.5 million total scans and an average of 253 scans per QR code, according to Uniqode’s platform data.
This volume is driven in part by the GS1 transition covered below, but also by brands using QR codes on packaging to deliver product information, sustainability certifications, and loyalty program access.
California is the leading state for CPG scanning volume.
79% of consumers are more likely to purchase products that have a scannable QR code providing additional product information, according to GS1’s 2024 US Pulse Survey.
Retail and eCommerce
Retail and eCommerce QR codes for retailers account for a 46% adoption rate, tied with product packaging as the second-highest category after hospitality, based on broader industry survey data.
QR codes are now embedded in the post-purchase experience as well. Return instructions, warranty registration, product setup guides, and upsell offers are all common QR code destinations in retail.
Finance
Finance generated 7.3 million total scans in 2025 on the Uniqode platform with an average of 263 scans per code, according to Uniqode’s scan data. Texas leads US finance scanning volume with 2.4 million scans. Peak scan window is 6 PM to 9 PM UTC.
Finance-sector QR codes include account verification, payment initiation, document submission, and branch wayfinding. This is one of the higher-trust deployment contexts, which makes security execution particularly important.
QR Code Marketing Performance Data
The marketing numbers in 2026 show that most brands have accepted QR codes as a standard channel. The gap between adopters and leaders is now in measurement and attribution, not just deployment.
56% of marketers expect higher revenue from QR codes this year, according to Uniqode’s State of QR Codes 2026 marketer survey.
94% of marketers increased their QR code usage in the past 12 months, and 86% plan to increase usage again in the next 12 months.
The measurement gap is significant. Among marketers tracking QR code performance, the most common metrics are click-through rate (30%) and customer engagement (30%), followed by conversion rate (22%) and sales or revenue (12%).
6% of marketers do not measure QR code performance at all, according to Uniqode’s marketer survey.
Only 1 in 8 marketers connects QR code scans to revenue impact. This attribution gap is the primary reason dynamic QR codes with analytics are growing faster than static formats.
The most-wanted improvement in QR code technology, according to the same survey: analytics (49%), faster loading (45%), dynamic QR codes (41%), greater compatibility (38%), and improved security (33%).
For a practical look at creative ways to use QR codes in campaigns, the placement choices with highest conversion context are table tents, product packaging, and direct mail.
Dynamic vs. Static QR Codes: What the Numbers Show
The shift toward dynamic QR codes is the clearest technical trend in the 2026 data. Dynamic codes allow you to change the destination URL after printing, track scan analytics, and run A/B tests on landing pages. Static codes cannot do any of these.
Dynamic QR codes now account for 65% of global QR code revenue share, having overtaken static formats, according to Mordor Intelligence.
73% of organizations have reduced printed materials or reprints using dynamic QR codes, according to Uniqode’s State of QR Codes 2026. This is particularly relevant for CPG brands that previously had to reprint packaging every time a URL or promotion changed.
If you are using free trackable QR codes for the first time, a dynamic code gives you redirect control and scan data that a static code never will.
The difference between static and dynamic QR codes comes down to editability and analytics. Static codes are locked at creation. Dynamic codes remain adjustable after print.
QR Code Safety and Trust Statistics
Consumer confidence in QR codes has grown, but it is not unconditional. The trust data from 2026 shows a gap between perceived safety and the actual threat landscape.
58% of US consumers feel somewhat or very confident that QR codes are safe to scan, according to Uniqode’s State of QR Codes 2026 consumer survey. 26% report trusting QR codes more than they did a year ago. 9% report declining trust.
Only 14% of consumers have ever encountered a QR code scam or phishing attempt, and 38% say they have never had a negative QR code experience. The majority of consumers are not personally aware of the threat volume.
The actual phishing data tells a different story. QR code phishing detections grew fivefold between August and November 2025 — from roughly 47,000 to 250,000 — according to Kaspersky Labs.
12% of all phishing attacks contained a QR code in 2025, according to KeepNet. That’s up from the initial quishing surge in 2023, when QR codes appeared in roughly 22% of phishing attacks during peak months, per KeepNet’s historical data.
The trust gap between consumer perception and actual risk is an opportunity for brands.
Using a branded short domain in your QR code URL, adding clear call-to-action text near the code, and ensuring fast, relevant landing pages all reduce hesitation among the 29% of consumers who remain uncertain about scanning safety.
GS1 Sunrise 2027: The Biggest QR Code Shift Most Brands Are Ignoring
This is the QR code story that most statistics articles have not covered. It matters for every brand that sells physical products.
GS1, the organization that created and manages global barcode standards, is coordinating the replacement of traditional UPC and EAN barcodes with 2D barcodes, primarily QR codes, across global retail. The target date is the end of 2027.
By the end of 2027, GS1 QR codes are targeted to be scannable alongside traditional UPC barcodes at retail checkout worldwide – UPC barcodes are not being retired. The new standard is already being tested in 48 countries representing 88% of world GDP, according to the GS1 global industry endorsement statement.
What changes: a GS1 QR code carries the same product identifier information as a UPC barcode but also embeds a URL.
When a consumer scans it at the store shelf, they reach a brand-controlled landing page. When a cashier scans it at checkout, it functions identically to the existing barcode.
This doubles the function of the barcode. The same code that the point-of-sale system reads for inventory and pricing becomes a consumer-facing QR code linking to product information, promotions, or sustainability data.
79% of consumers are more likely to purchase a product with a scannable QR code providing additional product information, according to the GS1 US 2024 Pulse Survey.
For CPG brands preparing for this transition, QR codes on packaging are both an infrastructure requirement and a conversion opportunity.
Brands using QR codes for product packaging today are building operational experience that will be required across the entire retail supply chain by the end of 2027.
What These Stats Mean for Your Business
Most QR code statistics are presented without any connection to what you should actually change about how you use them. If you’re looking for industry-specific implementation ideas, explore our guide to QR codes for different business types before choosing where to deploy them. This section maps the numbers to practical business decisions.
| Your situation | What the data tells you |
|---|---|
| Restaurant or hospitality business | 80%+ adoption and 26.9M scans in your sector means customers expect QR codes. Peak scan time is 5-8 PM. The opportunity is using the scan to capture loyalty data, not just replace the paper menu. |
| CPG or product brand | GS1 Sunrise 2027 is an industry-coordinated deadline, not a trend. Start testing QR codes on packaging now. 79% of consumers are more likely to buy when a QR code provides product info. |
| Retailer (physical or eCommerce) | 46% of your category uses QR codes. The ones doing it well connect the in-store scan to a post-purchase experience (returns, reviews, upsells). |
| Marketers running multi-channel campaigns | Only 1 in 8 marketers attributes scans to revenue. Using a dynamic QR code with UTM parameters solves this. The brands closing the attribution gap are the ones proving QR code ROI. |
| Event organizer | QR codes for event marketing cover ticketing, check-in, and session access. Transportation is one of the highest-scan-density categories (1,300 scans per code average). |
| Brands using QR codes on social media or ads | QR codes for social media work best when the scan destination is mobile-optimized and specific to the content context. A generic link kills conversion. |
The most consistent theme in the 2026 data: the scan is just the beginning. What happens after determines whether a QR code builds a customer relationship or wastes the placement.
For benefits of QR codes for business beyond the headline stats, the consistent pattern in the data is that performance is tied to landing page relevance, not just code placement.
FAQ
QR code statistics raise questions that go beyond the headline numbers. Here are answers to the questions most commonly asked alongside this data.
How many people scan QR codes in 2026?
102.6 million people in the US are expected to scan QR codes in 2026, according to eMarketer. That is roughly one in three Americans.
Globally, QR code scanning exceeds 2 billion scans per day.
Among regular consumers surveyed by Uniqode, 70% scan at least once a month and 44% scan weekly or daily.
Are QR codes still popular in 2026?
Yes. QR codes are more widely used now than at any point since their invention.
50.5% of global internet users scan at least one QR code every month, according to We Are Social’s Digital Statshot. Only 8% of consumers have never scanned a QR code.
Usage grew 323% from 2021 to 2025, and the growth has been sustained, not reversed.
What industry uses QR codes the most?
By total scan volume, consumer packaged goods (CPG) generated the most QR code scans in 2025 with 27.5 million, followed by hospitality at 26.9 million, according to Uniqode’s analysis of 188 million real scans.
Hospitality leads on scans per code, averaging 328 scans per code. That reflects the high-frequency use of restaurant QR menus throughout the day across breakfast, lunch, and dinner service.
What is the QR code market size in 2026?
The global QR code market is valued at $15.23 billion in 2026, according to Mordor Intelligence.
It is projected to reach $33.14 billion by 2031, growing at a 16.82% compound annual growth rate.
QR Code payment market size is expected to grow to $74.30 billion by 2034, according to Polaris Market Research.
Are QR codes safe to scan?
Most QR codes from legitimate businesses are safe. 58% of US consumers feel confident that QR codes are safe to scan, according to Uniqode’s 2026 consumer survey.
The real risk is that QR code phishing detections grew fivefold between August and November 2025 – from roughly 47,000 to 250,000 – according to Kaspersky Labs.
Scanning QR codes from unknown posters, unsolicited emails, or physical locations where a code could have been placed by a third party carries a meaningfully higher risk.
What is a dynamic QR code and why do the numbers favor it?
A dynamic QR code stores a redirect URL rather than the final destination, which means you can change where the code leads after it has already been printed or published.
Dynamic codes also track scan data, including when, where, and how often each code was scanned. That analytics layer is why they now account for 65% of global QR code revenue share, according to Mordor Intelligence.
The flexibility and measurement together justify the cost for most business use cases. The best trackable QR code generator comparison covers what to look for when choosing between platforms.
Wrapping Up
The QR code story in 2026 is not about whether to use them.
With 102.6 million US scanners, $15.23 billion in global market value, and an industry-wide retail infrastructure transition coming by the end of 2027, the adoption question is settled.
The practical question is whether your QR code program is built to measure results and adapt. Only 1 in 8 marketers currently connects scans to revenue.
The brands gaining ground are the ones using dynamic QR codes with clear landing pages and tracking attribution.
Treating the post-scan experience with the same care as the ad creative that drove the scan is what separates the programs that prove ROI from the ones that cannot.
If you are starting with QR codes for the first time or upgrading from static codes, the QR code generator is where to begin. Dynamic codes with tracking give you the analytics layer the majority of marketers are still missing.
For creating the graphics that carry your QR codes, graphic design tools for social media covers, which platforms handle animated and static social formats, with platform-specific picks and verified pricing.
Sources
- eMarketer, QR Code Scanning Projections
- Mordor Intelligence, QR Codes Market Report
- Polaris Market Research, QR Code Payment Market Analysis
- Uniqode, State of QR Codes
- We Are Social, Digital Global Statshot Report
- GS1, Global Industry Endorsement Statement, GS1 Standards for QR Codes
- GS1 US, Pulse Survey, Barcode Scanniversary Press Release
- TEAM LEWIS Research, Consumer Perceptions of QR Codes
- Kaspersky, detected a fivefold surge in QR code phishing attacks
- KeepNet, QR Code Phishing Trends
- Grand View Research, QR Code Payment Market